GIS Data Visualization: Turning Spatial Data Into Decisions
GIS data visualization is the practice of turning spatial data into maps, dashboards, and narratives that people can read and act on. It spans static maps, interactive web maps, ArcGIS Dashboards, and Esri StoryMaps. The goal is not a prettier map but a clearer decision, which means choosing the format that fits the audience and the question.
Spatial data is only as valuable as the decisions it drives, and most data never reaches that point because it stays locked in a format only a GIS analyst can read. Visualization is the bridge. Done well, it lets a council member, a funder, or an operations lead grasp a pattern in seconds that would take an analyst a paragraph to explain. This guide covers the main visualization formats, how to match them to an audience, and the design principles that separate a map that informs from one that merely decorates.
Why visualization is the deciding step
A spatial analysis can be technically flawless and still fail, because the people who make decisions never understood it. Visualization is where the work either lands or stalls. The same dataset can become a static figure in a report, a live dashboard on an operations wall, or an interactive narrative that walks a stakeholder through a finding. The format is a choice, and that choice determines whether the analysis changes anything.
The main formats, and when each fits
Static maps
A static map is a fixed image: a figure in a report, a slide, or a printed exhibit. It is the right choice when the message is singular and the medium does not support interaction. Static maps are fast to produce and impossible to misuse, but they cannot answer follow-up questions. Our breakdown of StoryMaps versus static maps covers this trade-off in detail.
Interactive web maps
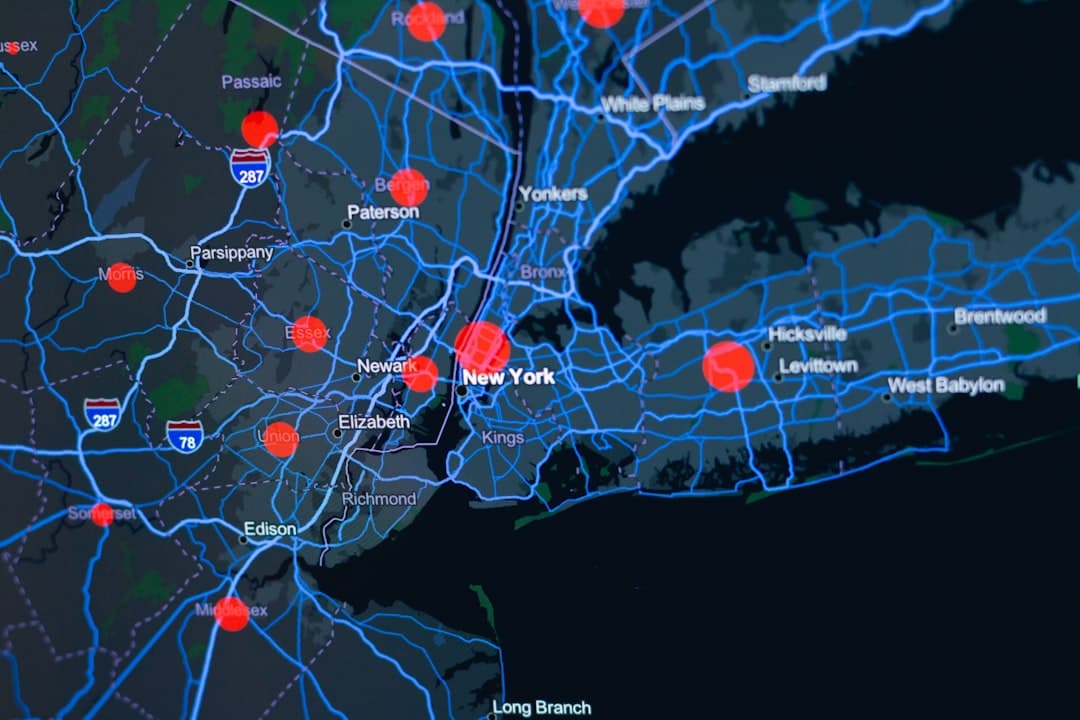
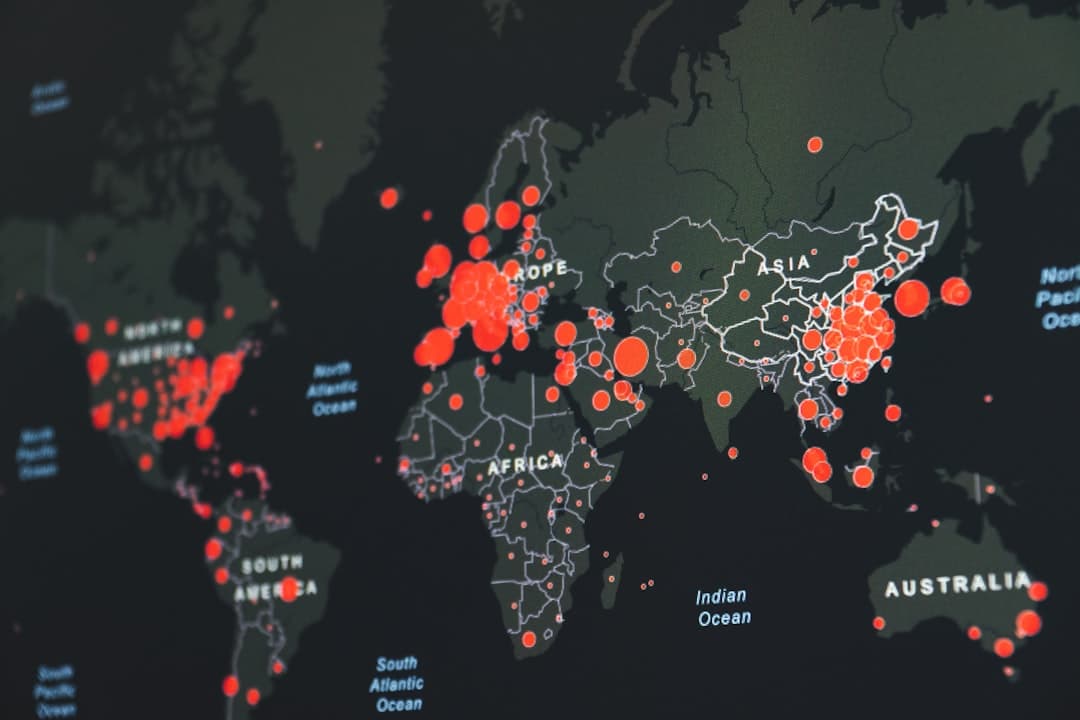
An interactive web map lets the viewer pan, zoom, toggle layers, and click features for detail. It suits audiences who need to explore rather than receive a single conclusion. Built on ArcGIS Online, these maps publish from feature services and update as the underlying data changes.
ArcGIS Dashboards
A dashboard pairs a map with charts, counters, and lists that update in real time. Dashboards are built for monitoring: active work orders, asset status, incident counts, or program metrics. They answer the question “what is happening right now” better than any other format, which is why operations teams rely on them.
Esri StoryMaps
A StoryMap combines maps, text, and media into a guided narrative. It is the strongest format when the audience is non-technical and the goal is persuasion or explanation: a funding case, a project recap, or a public-engagement piece. Our gallery of Esri StoryMap examples shows the format driving real decisions.
| Format | Best for | Audience | Built with |
|---|---|---|---|
| Static map | A single, fixed message | Report and slide readers | ArcGIS Pro |
| Interactive web map | Exploration and self-service | Analysts and engaged users | ArcGIS Online |
| Dashboard | Real-time monitoring | Operations teams | ArcGIS Dashboards |
| StoryMap | Persuasion and explanation | Non-technical stakeholders | Esri StoryMaps |
Match the format to the audience and the question
The most common visualization mistake is building for the analyst instead of the audience. A dense interactive map with twenty toggleable layers is a gift to a GIS team and a wall to a board member. Start from two questions: who is the audience, and what decision are they making? A board approving funding needs a StoryMap. A dispatcher tracking crews needs a dashboard. A planner exploring scenarios needs an interactive map. A one-page briefing needs a static figure. The data may be identical; the format is not.
Design principles that make a map readable
- One message per view. Decide the single thing each map should communicate and cut everything that competes with it.
- Color with intent. Use sequential color ramps for magnitude and distinct hues for categories. Avoid rainbow schemes that imply an order that is not there.
- Respect the non-expert. Label clearly, define any technical term, and never assume the viewer reads legends the way an analyst does.
- Show the data honestly. Class breaks, normalization, and projection choices all shape the story. Choose them to clarify, never to mislead.
- Design for the device. A dashboard on a control-room screen and a StoryMap on a phone are different design problems.
From analysis to a result leadership acts on
Visualization is also where technical work meets organizational reality. A perfectly designed map still has to be presented in terms a decision-maker values. Our guides on presenting GIS data to a board of directors and the ROI of GIS connect the visual to the decision, which is where value is actually realized.
Working with GeoLever on visualization
GeoLever builds geospatial visualizations across all four formats, from StoryMaps through GeoStory to dashboards and interactive maps under GeoConsult. Diana Muresan, a Senior GIS Engineer and Certified ArcGIS Expert, leads the design and build, so the work is grounded in both cartographic craft and platform depth. Every engagement is scoped and quoted within 48 hours of a 30-minute discovery call. Explore the services or book a discovery call to discuss your project.
Common visualization mistakes and how to avoid them
Most weak geospatial visualizations fail in a handful of predictable ways. Knowing the patterns makes them easy to avoid.
- Too many messages in one view. A map that tries to say five things says nothing. Decide the single point of each view and remove what competes with it.
- Rainbow color ramps. A spectrum of hues implies an order that the data does not have. Use a sequential ramp for magnitude and distinct, limited hues for categories.
- Unnormalized counts. Mapping raw totals across areas of different size or population usually just maps where the most people are. Normalize to rates or densities when the question is about intensity.
- Misleading class breaks. The same data can tell opposite stories depending on how classes are cut. Choose breaks that clarify the pattern honestly, and disclose the method.
- Designing for the analyst. A dense interactive map with twenty toggles delights a GIS team and loses a board member. Build for the person making the decision.
How visualization fits the wider geospatial workflow
Visualization is the last step, and its quality is capped by everything before it. A polished dashboard built on inconsistent data is a confident presentation of unreliable numbers. That is why strong visualization work starts upstream, with sound geodatabase design, standardized coordinate systems, and attribute domains that keep values consistent. When the foundation is solid, the visual layer becomes a straightforward translation of trustworthy analysis. When it is not, no amount of cartographic polish can rescue the result.
This is also where the platform choice shows through. ArcGIS Online publishes interactive web maps and hosts the feature services that dashboards and Experience Builder applications read from. ArcGIS Pro produces precise static cartography. Leading with ArcGIS Online keeps the visualization layer connected to live data, so a published map updates as the underlying records change rather than freezing at the moment it was made.
From a single map to a visualization system
Organizations often start with one map and gradually need a system: a public StoryMap for outreach, an internal dashboard for operations, and an interactive app for staff who explore scenarios. Planned together, these share a common data foundation and a consistent visual language, so a viewer moving between them sees one coherent program rather than three disconnected artifacts. Treating visualization as a system rather than a series of one-off requests is what turns scattered maps into a durable communication capability. It also lowers the cost of each new view, because the data and design groundwork is already in place.
Frequently Asked Questions
What is GIS data visualization?
It is the practice of turning spatial data into maps, dashboards, and narratives that people can read and act on. The formats range from static maps and interactive web maps to ArcGIS Dashboards and Esri StoryMaps. The aim is a clearer decision, which means choosing the format that fits the audience and the question rather than the most elaborate map.
When should I use a dashboard instead of a StoryMap?
Use a dashboard when the goal is real-time monitoring, such as tracking work orders, assets, or incidents, for an operations audience. Use a StoryMap when the goal is persuasion or explanation for a non-technical audience, such as a funding case or a project recap. Dashboards answer “what is happening now,” while StoryMaps walk a viewer through a finding.
What is the difference between a static map and an interactive map?
A static map is a fixed image suited to reports and slides, fast to produce but unable to answer follow-up questions. An interactive web map lets viewers pan, zoom, toggle layers, and click features, which suits audiences who need to explore. Interactive maps are built on ArcGIS Online and update as the data changes.
What makes a map easy for non-technical people to read?
Limit each view to one message, use color with intent, label clearly, define technical terms, and present the data honestly through sensible class breaks and normalization. The most common failure is designing for the analyst rather than the decision-maker who will actually act on the map.
Which Esri tools are used for visualization?
Static maps and cartography come from ArcGIS Pro, interactive web maps from ArcGIS Online, real-time monitoring from ArcGIS Dashboards, and guided narratives from Esri StoryMaps. Interactive applications use out-of-the-box tools such as Experience Builder rather than custom code.