GIS for Utilities: The Network, the Stack, and What It Costs
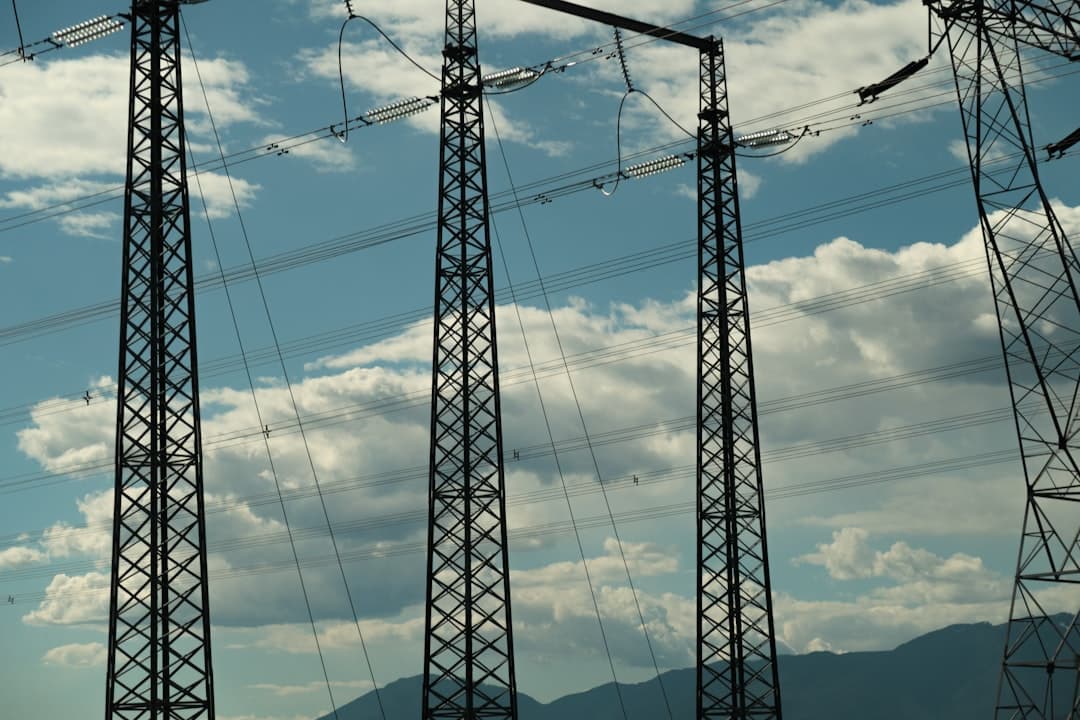
GIS for utilities is the geospatial system that water, electric, gas, and telecom utilities use to manage their network assets, dispatch crews, model service impacts, and meet regulatory reporting requirements. Most utilities run on the Esri stack: ArcGIS Online or ArcGIS Enterprise for the platform, Utility Network for advanced electric and water modeling, Field Maps and Survey123 for field operations, and ArcGIS Dashboards for control-room visibility.
Why Utilities Live on GIS
A utility’s entire business is a network of spatial assets. Mains, services, valves, hydrants, transformers, poles, conductors, switches, manholes, conduit. None of it is useful without knowing where it is, how it connects, and what state it is in. A geographic information system is not a side tool for a utility. It is the system of record for the network itself.
The operational pressures push the same direction. Field crews need accurate, current asset data on their devices. Operations need to model service impacts when a feeder trips or a main breaks. Engineering needs to plan new construction against existing infrastructure. Regulators require defensible reporting on outages, water quality, leak detection, and capital programs. Customer service needs to answer the “when is my service back” question with credible spatial data behind the answer.
Where GIS Sits in a Utility Stack
| System | Role | GIS Integration |
|---|---|---|
| GIS (ArcGIS Online or ArcGIS Enterprise) | System of record for network assets and topology | The hub. Feeds every other system. |
| Outage Management System (OMS) | Real-time outage tracking and crew dispatch (electric) | Consumes GIS network model. Returns outage status. |
| SCADA | Real-time control and telemetry | Provides device state. GIS provides spatial context. |
| Asset Management (Cityworks, Maximo, Cartegraph) | Work orders, inspections, maintenance history | GIS provides the asset inventory. Asset management writes history back. |
| Customer Information System (CIS) | Billing, meters, accounts | Linked by service address and meter location. |
| Field Maps and Survey123 | Mobile data collection and inspection | Native Esri. Connects directly to feature services. |
| ArcGIS Dashboards | Control room and executive visibility | Native Esri. Pulls from feature services and OMS. |
The most common pattern is ArcGIS Enterprise on-premise (often paired with ArcGIS Online for public-facing work and field collaboration), the Esri Utility Network configured for electric or water, deep integrations to OMS and SCADA, and Field Maps deployed across every field role. Many utilities started on the Esri Geometric Network and are now in the middle of a Utility Network migration. The Utility Network is significantly more capable for complex modeling and tracing, and Esri is steering everyone toward it.
What Utility GIS Programs Actually Do
Network model maintenance
The network model is the spatial representation of how the system connects. Sources, conductors, devices, services. Mature electric and water utilities maintain it in the Esri Utility Network. Day-to-day, this means processing construction-as-built drawings, updating the model when crews replace assets, running validation against the topology rules, and publishing the updated model to OMS, SCADA, and consuming apps.
Field inspections and asset condition
Hydrant flow testing, manhole condition, transformer inspections, pole inspections, leak surveys, valve exercising. Field Maps on a tablet captures the inspection with the asset selected from the live feature service. Attribute domains enforce valid condition codes. Survey123 handles structured inspections with calculated fields and skip logic. Inspections roll up to ArcGIS Dashboards for compliance reporting.
Outage and incident response
The OMS is the primary tool for electric outage management, but GIS feeds it the model and the dashboards everyone watches. Water utilities use ArcGIS Dashboards and Operations Dashboards directly for main breaks, isolation valve planning, and customer impact reporting.
Engineering and capital planning
Engineering design happens in ArcGIS Pro against the current network model. Proposed projects (a new feeder, a pipe replacement, a service expansion) are modeled spatially, costed, and brought into the capital program. StoryMaps and Experience Builder apps communicate the capital plan to regulators, elected officials, and the public.
Regulatory reporting
SAIDI, SAIFI, CAIDI for electric. Water loss audits and consumer confidence reports for water. Damage prevention metrics for gas. Each has a spatial backbone. A utility that runs reporting from a clean GIS spends a fraction of the time pulling regulator-ready data than one that maintains parallel spreadsheets.
The Esri Stack for Utilities
Lead the conversation with ArcGIS Online wherever it fits, but be realistic: most utilities will run ArcGIS Enterprise on-premise for the core network model because of integrations, data sensitivity, and IT policy. The smart pattern is hybrid. ArcGIS Enterprise hosts the network model and the integration-heavy workloads. ArcGIS Online hosts the field collaboration layers, the public-facing apps, and the cross-department dashboards. Our piece on ArcGIS Enterprise vs ArcGIS Online walks through the decision in detail.
For data integrity, attribute rules and attribute domains are not optional in a utility geodatabase. The cost of bad data in a network model is real: a misclassified valve closes the wrong service, a mis-attributed transformer routes the wrong crew. Our piece on attribute rules in ArcGIS Pro walks through the automation pattern utilities use to enforce data quality at the source.
Where Utility GIS Programs Get Stuck
The recurring failure patterns are network-specific.
Geometric Network to Utility Network migration drift. The utility started planning migration three years ago. The data is partially cleaned. The Utility Network rules are configured for one feeder. The integrations to OMS still expect the old model. Migration is a focused project, not a background activity, and it stalls when no one owns it.
As-built backlog. Construction finishes, the as-built drawings sit in a queue, the network model lags reality by months or years. Field crews lose trust in the data. The fix is structural: a documented as-built workflow, attribute rules that flag missing data, and a team capable of working through the backlog.
Field app sprawl. Different departments commissioned different mobile apps over the years. Field Maps for one group, a custom app for another, paper for the third. Consolidation onto Field Maps and Survey123 simplifies training, IT support, and data flow.
Reporting that takes weeks. Regulator reports require pulling from GIS, OMS, CIS, and maintenance management, reconciling, and formatting. When that pipeline is manual, every reporting cycle burns analyst time. The fix is to design the spatial and temporal data model so the reports run from queries, not assembly.
Funding Utility GIS Work
Utility geospatial work funds itself when scoped well. Three patterns lead. Rate-case justification: capital and operating spend on GIS is part of the cost of service. A defensible spatial inventory of assets backs up depreciation and replacement schedules in front of the regulator. Federal and state grants: drinking water and wastewater funding, electric grid resilience programs, broadband programs (BEAD), and FEMA mitigation grants all have spatial reporting requirements. The grant pays for the GIS work that backs the application. Capital project tag-along: large capital projects routinely fund the GIS deliverables that document the new asset.
When to Bring in a Consultant
Utility geospatial work is technical, integration-heavy, and high-stakes. The cases where outside help pays for itself: a Utility Network migration (focused project, narrow expertise); a major data cleanup against attribute rules; a Field Maps or Survey123 standardization across departments; a license audit (utilities routinely overspend on ArcGIS Enterprise tiers they have outgrown); a public-facing StoryMap for a capital program, a service area expansion, or a resilience plan that needs to land with the public and regulators.
| Engagement | Typical Utility Use | Price |
|---|---|---|
| GeoStory | StoryMap on a capital program, resilience plan, or service expansion | $2,500 to $7,500 |
| GeoConsult | Utility Network configuration, data cleanup project, Field Maps rollout, license audit | $5,000 to $15,000 per project |
| GeoPartner | Embedded senior GIS engineer on the migration or program | $10,000 to $25,000 per month |
Frequently Asked Questions
What is GIS used for in utilities?
Utilities use GIS as the system of record for their network assets, the platform for field data collection and inspections, the source for outage and incident response, the basis for engineering and capital planning, and the spatial backbone for regulatory reporting. Almost every operational and customer-facing workflow in a utility has a spatial dimension that GIS makes manageable.
What is the Esri Utility Network?
The Utility Network is Esri’s modern data model and software platform for managing complex utility networks. It replaces the older Geometric Network and is designed for electric, water, gas, and telecom. It supports advanced tracing, subnetwork management, terminal-level connectivity, and rules-driven validation. Esri is steering all utility customers toward the Utility Network.
Should a utility run ArcGIS Online or ArcGIS Enterprise?
Most utilities run a hybrid: ArcGIS Enterprise on-premise for the core network model and integration-heavy workloads, and ArcGIS Online for field collaboration, public-facing apps, and cross-department dashboards. Pure on-premise is increasingly rare; pure SaaS is uncommon for large utilities with complex integrations.
How does GIS integrate with OMS and SCADA?
The network model lives in GIS. The OMS consumes the model to know how the system connects and routes crews based on it. SCADA provides real-time device state that overlays the GIS-derived model in operations dashboards. The integration is most often built around feature services and a documented synchronization pattern from the GIS into the OMS.
How long does a Utility Network migration take?
For a mid-sized utility, eighteen to thirty-six months is typical. Data cleanup is the dominant variable. Utilities with clean Geometric Network data can move faster. Utilities with two decades of accumulated drift will spend most of the project on data preparation rather than on the Utility Network itself.
What is the most underused capability for utility GIS programs?
Attribute rules. Most utility geodatabases were built before attribute rules were available and never retrofitted. Adding rules to enforce valid asset codes, required fields on edit, and topology validation catches data errors at the source instead of in regulator reports. See our piece on ArcGIS features most organizations never use.
Getting Started
Utility geospatial work rewards specificity. A Utility Network configuration project, a Field Maps standardization, a StoryMap for a capital program, a license audit. Bring the deliverable, the constraint, and the timeline. You can start a conversation at geolever.co/contact.